Grabien is best known for indexing what the media says. Today we are launching a sister project that indexes something different: what the economic data actually shows. It is called the Reality Index, and it lives at RealityIndex.co.
The Reality Index is a parallel measurement of American consumer prices. It uses the Bureau of Labor Statistics' own household-spending weights — the exact ones used to construct the official Consumer Price Index — but substitutes real retail dollar data for CPI's quality-adjusted methodology. The headline finding: a basket of goods and services that cost $100 in 2000 costs $246 today by the Reality Index, versus $187 by the official CPI. That is a 32% cumulative gap over 25 years. Extended back to 1980, the same gap compounds further: $516 versus $391 by the official measurement.
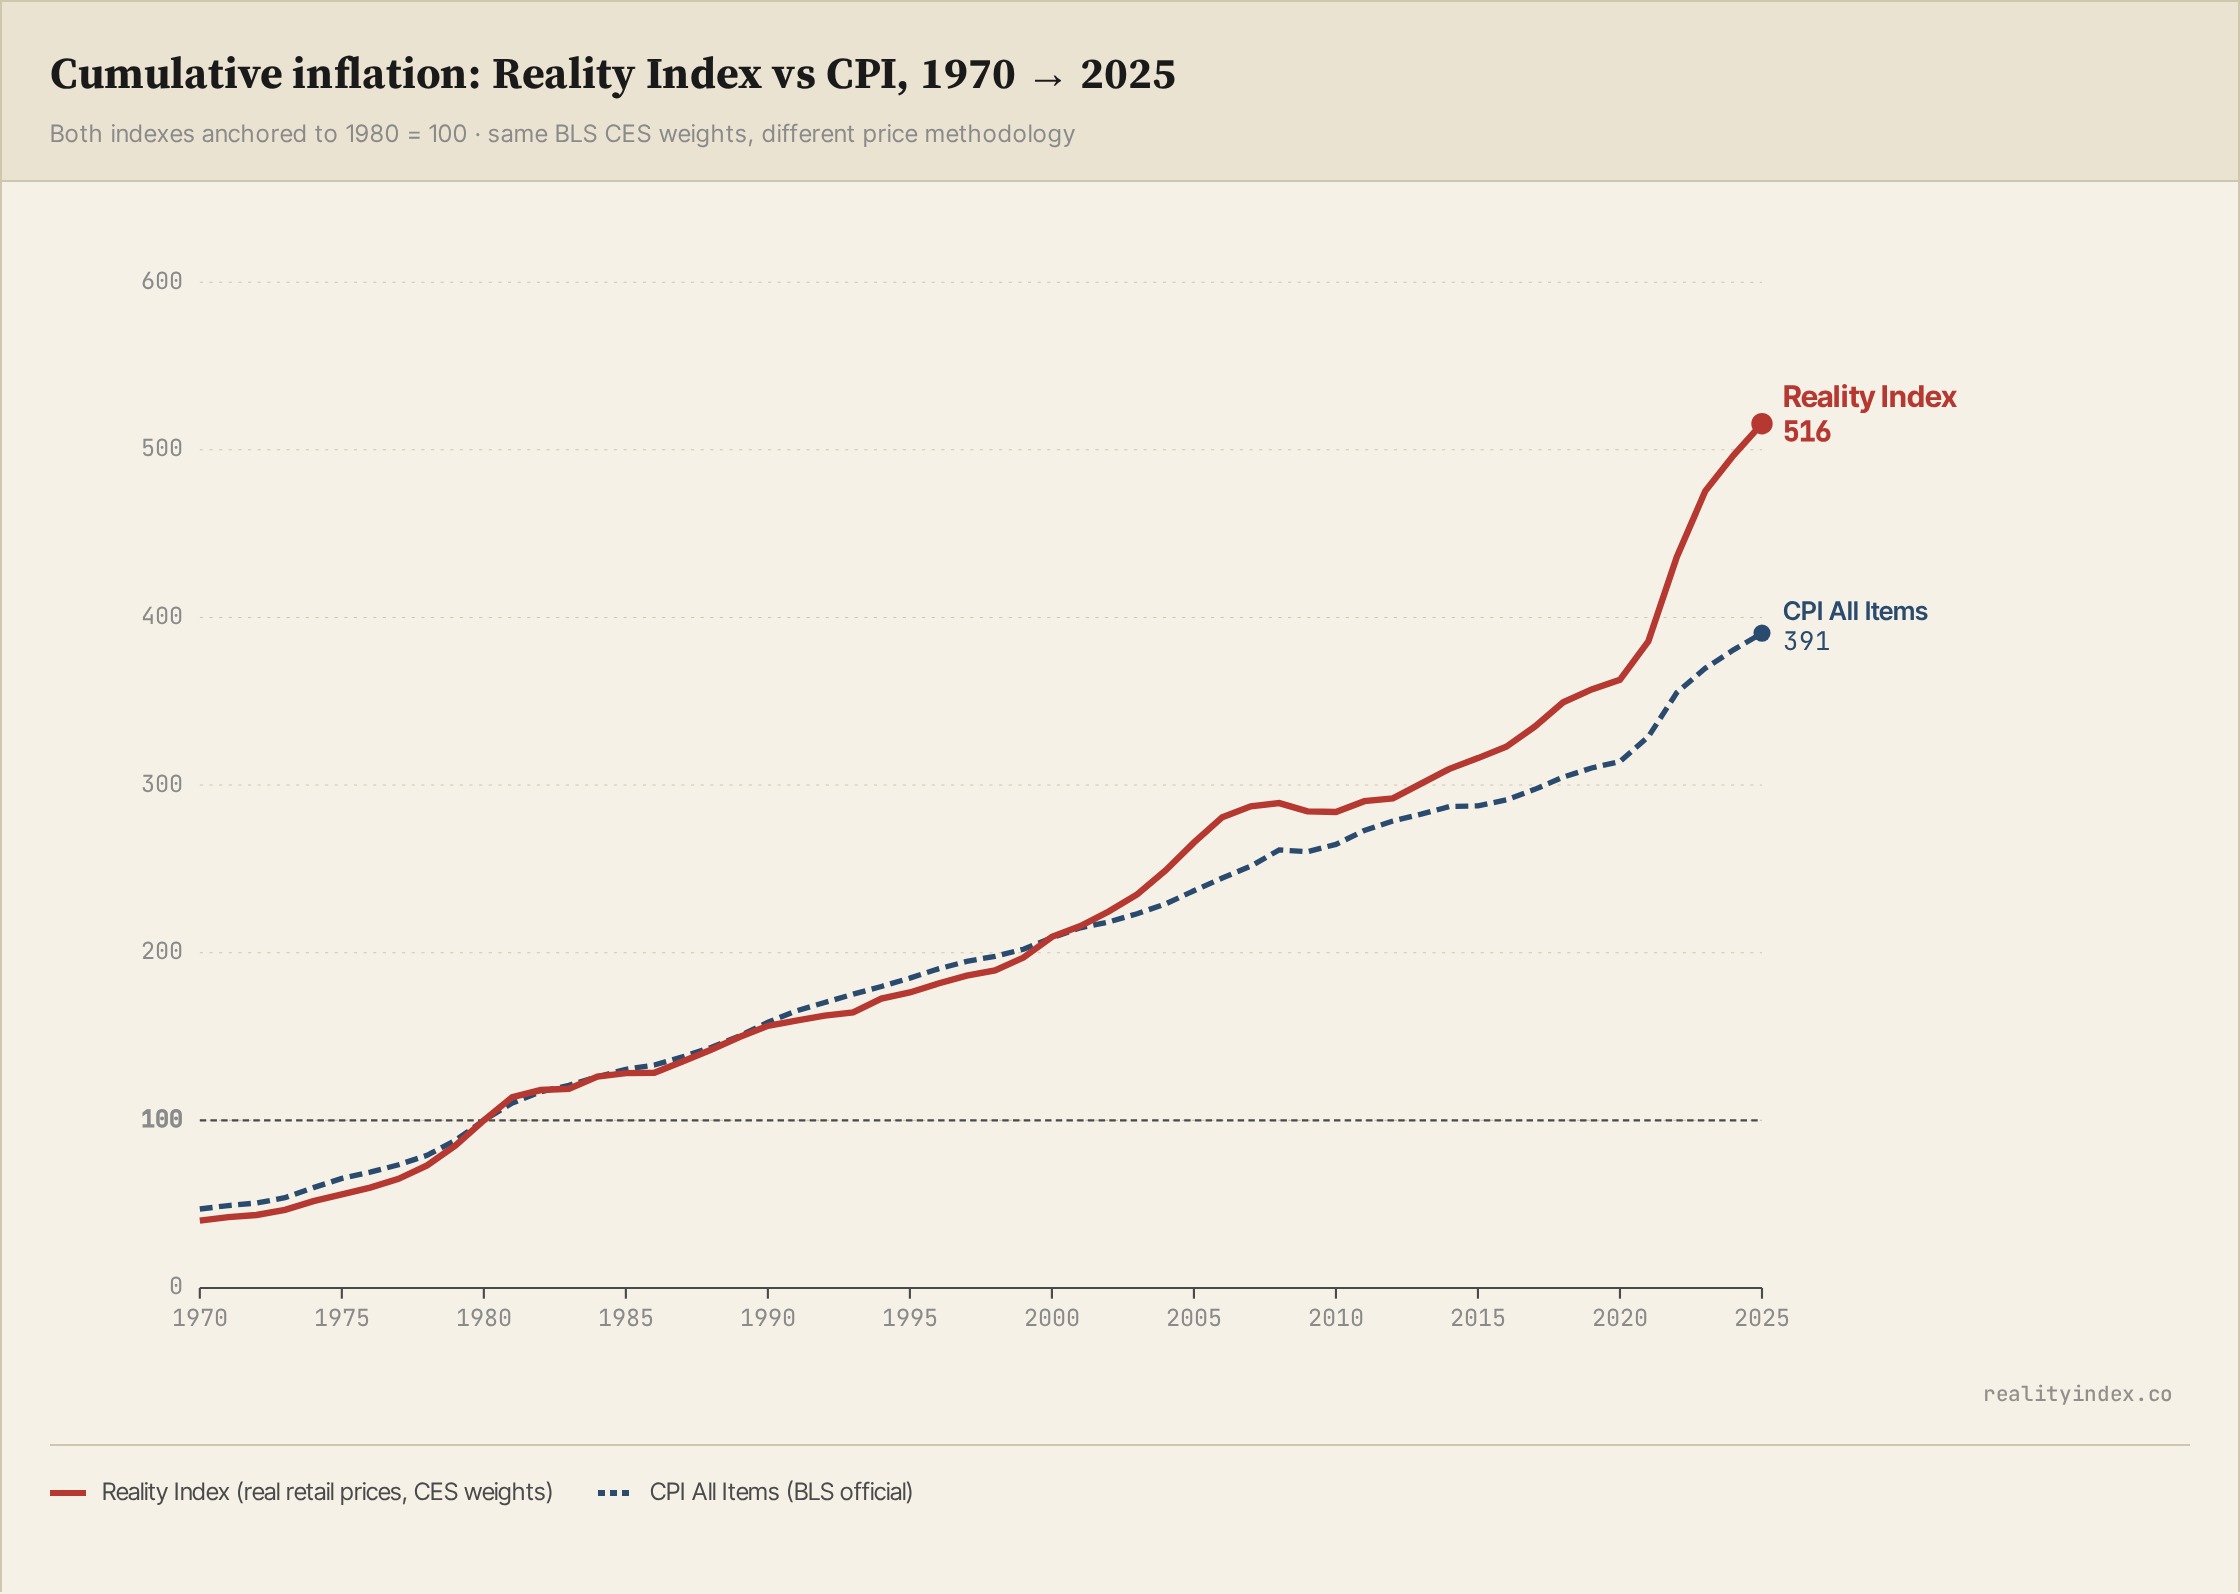
The number is not a surprise to anyone who has been paying for their own groceries, rent, or health insurance. The surprise, when you look closely at how CPI is constructed, is that the official statistic understates the gap as little as it does.
For five years, Grabien has built tools to make broadcast and podcast media searchable, indexable, and quotable for journalists, researchers, and policy professionals. The Reality Index is the same instinct applied to a different domain: take a measurement that is widely cited and trusted, examine the methodology underneath, and make the underlying data accessible to anyone who wants to evaluate it for themselves.
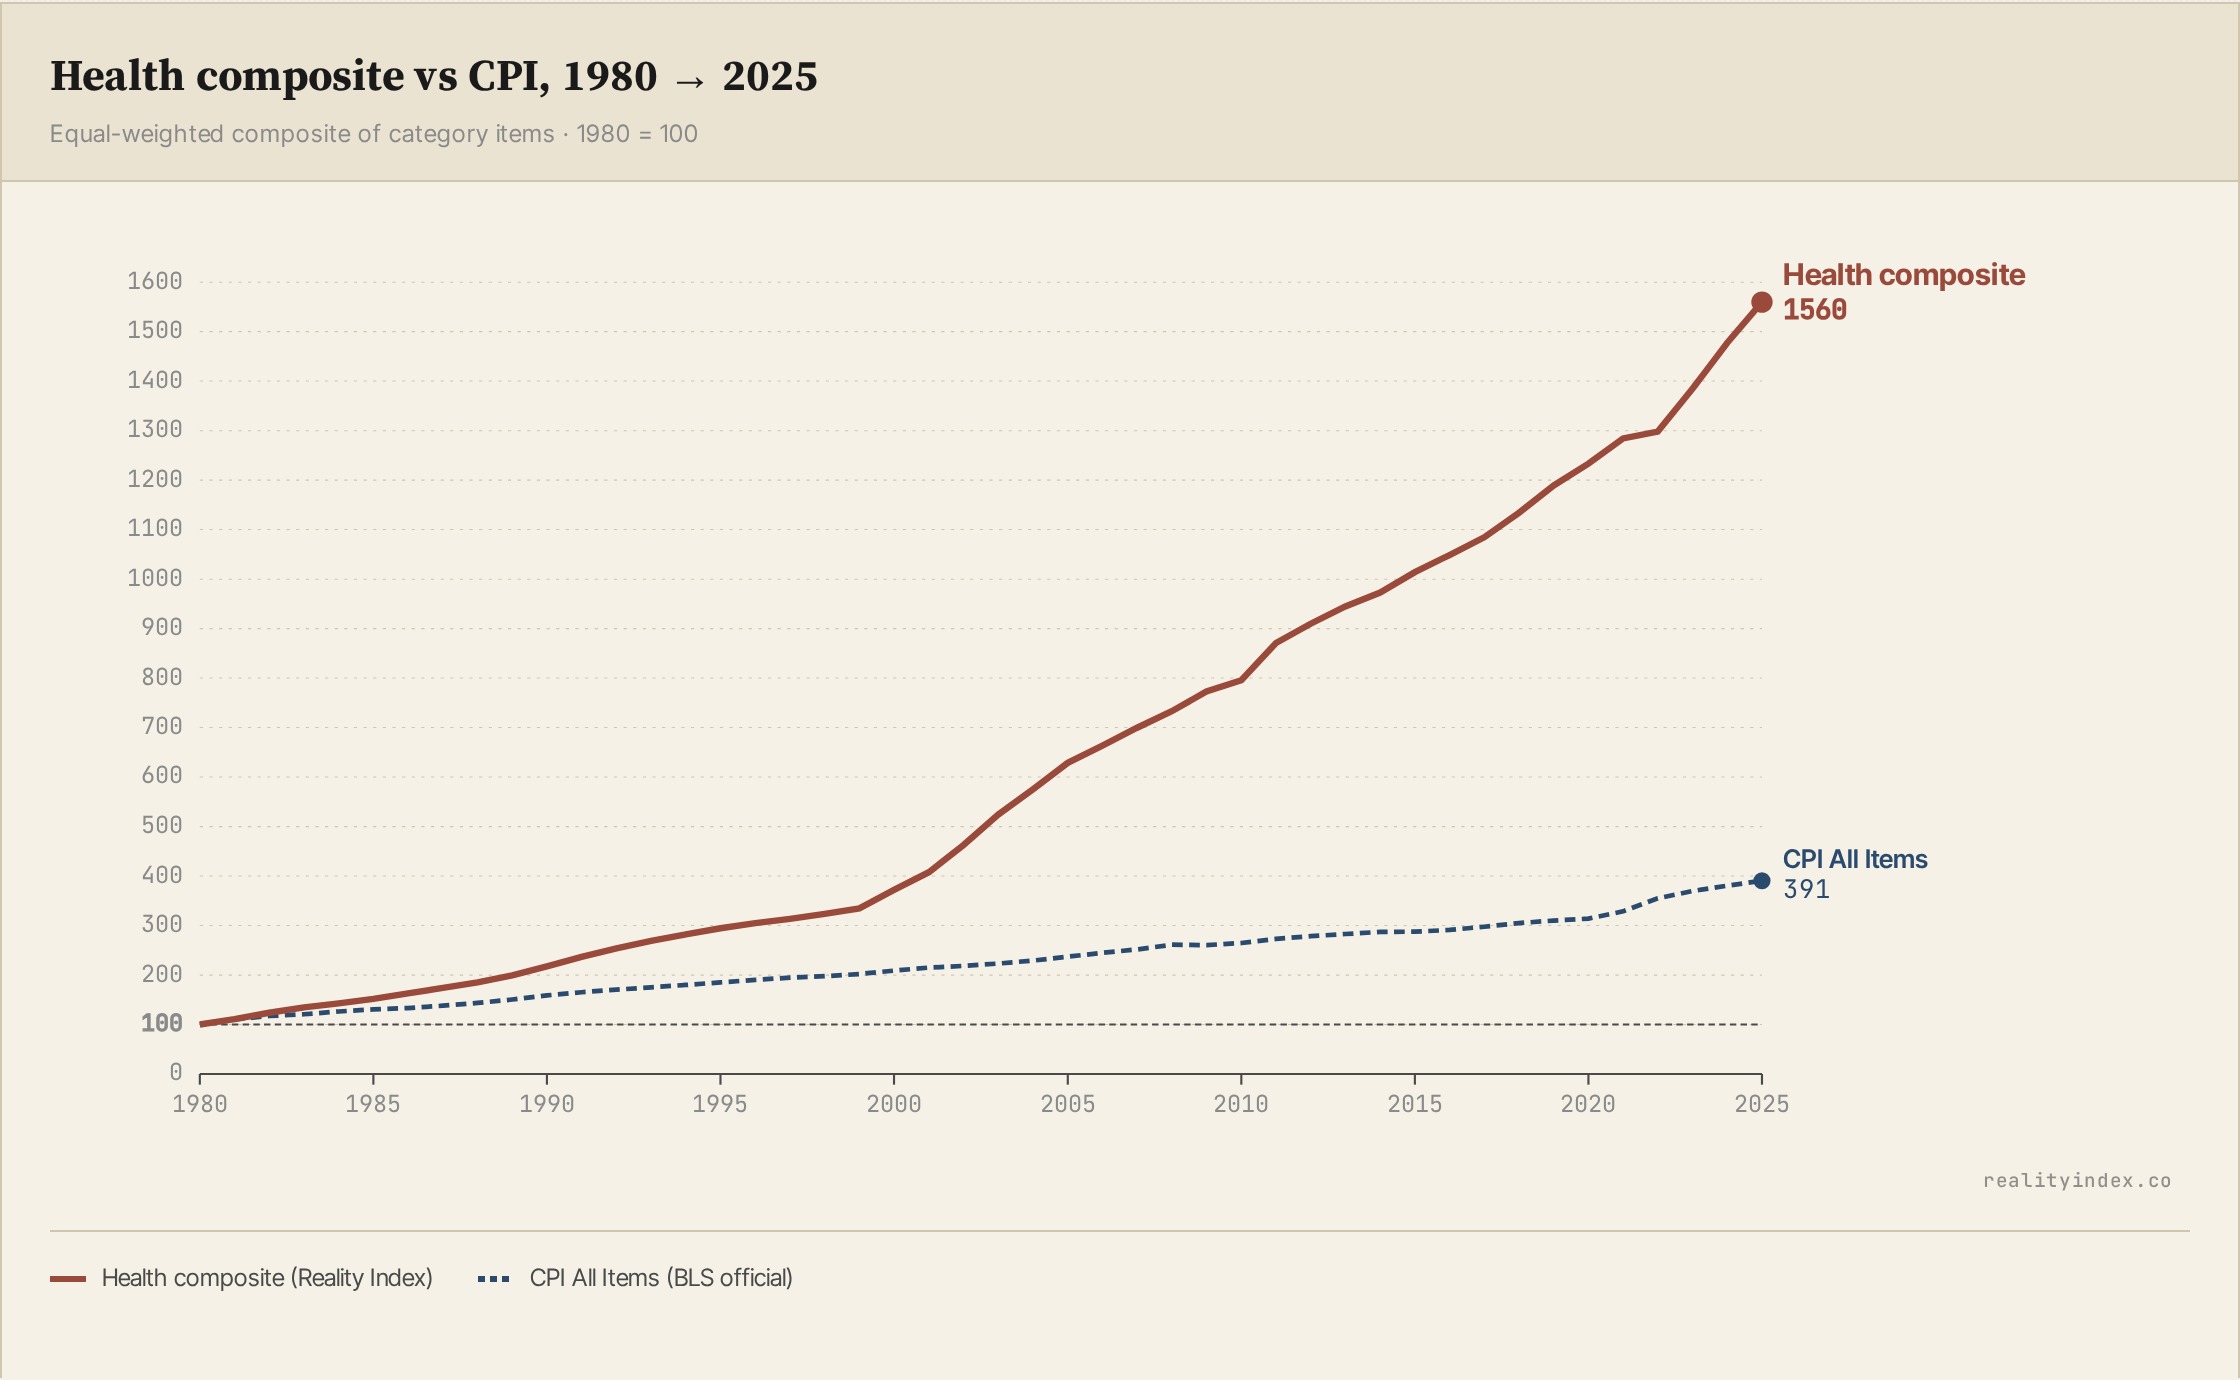
CPI is a methodologically sophisticated index. It is also, by any honest read of its construction, an index that systematically understates the price growth of things American families cannot avoid buying. Owner's Equivalent Rent — what homeowners would theoretically pay if they were renting their own homes — is roughly 24% of the index, but it has lagged actual home prices by about 3 percentage points per year since 1995. The medical care subindex tracks provider list prices for hospital stays and doctor visits, not the family health insurance premium that most Americans pay; according to Kaiser Family Foundation, the average family premium has grown 4.66 times since 1999, while CPI medical has grown 2.32 times over the same period. Hedonic adjustment treats faster computers and better smartphones as deflation, even when families pay more in dollars. Geometric mean aggregation mathematically produces a lower number than the arithmetic mean would.
Each of these methodological choices has a defensible rationale. Each is defended in the academic literature. And each, since the 1980s, has had the arithmetic effect of producing a lower reported inflation rate than the methodology that preceded it. None has moved the number in the other direction. That asymmetric pattern is the thing worth examining honestly, and it is the foundation of what the Reality Index measures.
The Reality Index publishes every component, every weight, and every methodology choice openly. The site includes:
The project is built to be cited and challenged. The standing commitment is to revise the methodology when revision is warranted. If a more rigorous data source, a methodology improvement, or a measurement error is identified, the site will publish the update with a timestamped methodology note. Methodology suggestions and data corrections from any reader are welcome at info@realityindex.co.
The Reality Index is the first in a series of intelligence projects Grabien plans to release over the next several years. The instinct is the same one that built our transcript indexing service: take a public-interest dataset, make it transparent, and put it where anyone can use it. The headline number — what the federal government's inflation statistic actually captures and what it does not — is one place that work matters. There are others.
For now, the data is live (we’ve linked it in Grabien News’ header for easy access). The methodology is one click away. With a bit of luck, the conversation about American inflation can now be a little more honest.