
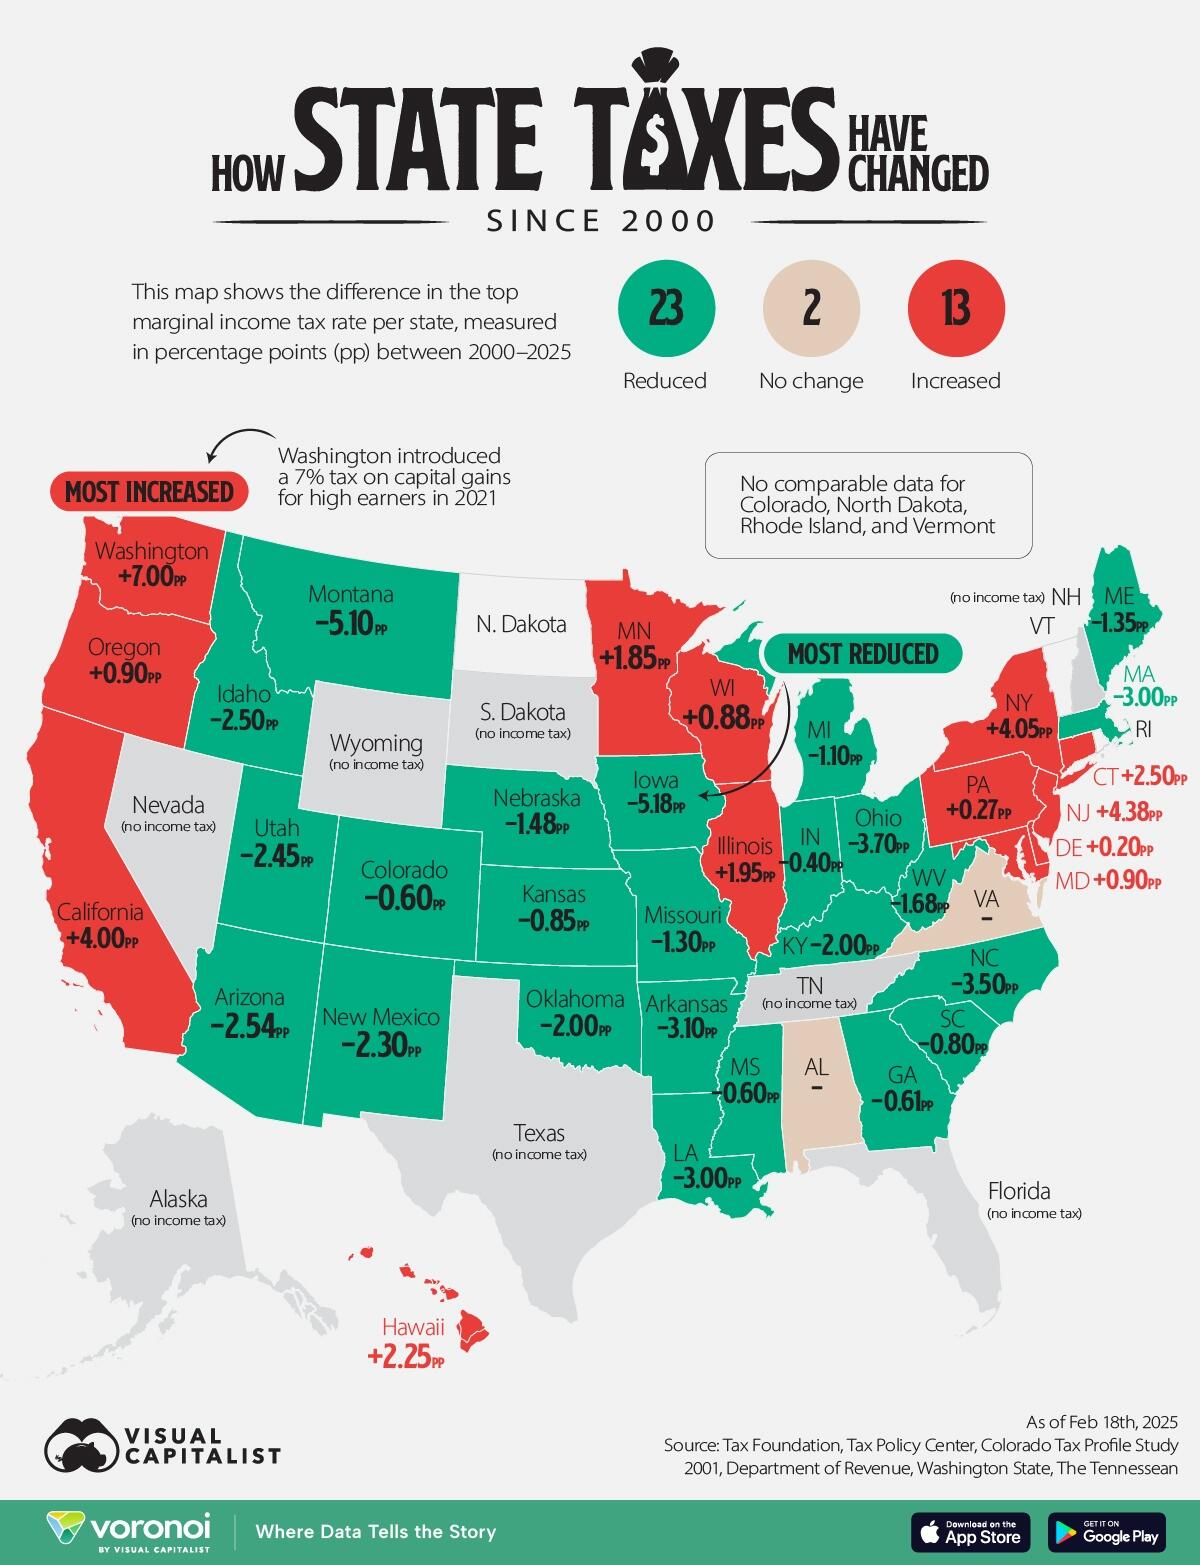
In this graphic, Visual Capitalist's Pallavi Rao compares how the state income taxes have changed between 2000 and 2025. The visualized value is the difference in the top marginal tax rate, measured in percentage points (pp).
We also published just the current top rate in 2025, earlier this month for further context.
Current and historical data for this map is sourced from the Tax Foundation and Tax Policy Center.
Changes are not compared for four states—Rhode Island, Vermont, North Dakota, and Colorado—since their 2000s tax rates were charged as a percentage of federal liabilities owed.
As a result, they have been grayed out on the map and are not discussed in this article.
States Income Tax Burdens Have Broadly Fallen Since 2000Led by Iowa (-5.18pp), 23 states reduced their top marginal income tax rate since 2000.
Furthermore, two states (Tennessee and New Hampshire) removed income taxes entirely, joining six others that do not tax incomes.
StateCode2000 Top Rate2025 Top RateChange AlabamaAL5.05.0No change AlaskaAK0.00.0No income tax ArizonaAZ5.02.5-2.54 pp ArkansasAR7.03.9-3.10 pp CaliforniaCA9.313.3+4.00 pp ColoradoCO% of federal liability4.4n/a ConnecticutCT4.57.0+2.50 pp DelawareDE6.46.6+0.20 pp FloridaFL0.00.0No income tax GeorgiaGA6.05.4-0.61 pp HawaiiHI8.811.0+2.25 pp IdahoID8.25.7-2.50 pp IllinoisIL3.05.0+1.95 pp IndianaIN3.43.0-0.40 pp IowaIA9.03.8-5.18 pp KansasKS6.55.6-0.85 pp KentuckyKY6.04.0-2.00 pp LouisianaLA6.03.0-3.00 pp MaineME8.57.2-1.35 pp MarylandMD4.85.8+0.90 pp MassachusettsMA12.09.0-3.00 pp MichiganMI4.44.3-1.10 pp MinnesotaMN8.09.9+1.85 pp MississippiMS5.04.4-0.60 pp MissouriMO6.04.7-1.30 pp MontanaMT11.05.9-5.10 pp NebraskaNE6.75.2-1.48 pp NevadaNV0.00.0No income tax New HampshireNH5.00.0No income tax New JerseyNJ6.410.8+4.38 pp New MexicoNM8.25.9-2.30 pp New YorkNY6.910.9+4.05 pp North CarolinaNC7.84.3-3.50 pp North DakotaND% of federal liability2.5n/a OhioOH7.23.5-3.70 pp OklahomaOK6.84.8-2.00 pp OregonOR9.09.9+0.90 pp PennsylvaniaPA2.83.1+0.27 pp Rhode IslandRI% of federal liability5.99n/a South CarolinaSC7.06.2-0.80 pp South DakotaSD0.00.0No income tax TennesseeTN6.00.0No income tax TexasTX0.00.0No income tax UtahUT7.04.6-2.45 pp VermontVT% of federal liability8.75n/a VirginiaVA5.85.8No change WashingtonWA0.07.0+7.00 pp West VirginiaWV6.54.8-1.68 pp WisconsinWI6.87.7+0.88 pp WyomingWY0.00.0No income taxNote: Washington’s 7% tax on capital gains has been listed as an income tax by the source. This is discussed further in the next section.
Many states have switched to flat tax rates in the past 25 years, with Arizona, Georgia, Idaho, Iowa, Kentucky, Louisiana, Mississippi, North Carolina, and Utah reducing both the rate and multiple brackets to just the one.
However, some argue that flat rates are regressive as it imposes a larger burden on low income households than higher incomes ones.
Only two states, Alabama and Virginia, have made no changes.
So, Who Increased Their Tax Rates?Thirteen states and D.C. increased the top rate, with Washington (+7.0 pp) registering the most increase.
However Washington’s 7% flat rate is only applicable for earnings from stocks and bond sales that are above $250,000.
There is an argument that a capital gains tax is different from an income tax since it requires both a sale and declared profit to incur the tax. Furthermore, as far back as 1933, a statewide income tax in Washington was ruled unconstitutional.
However, to stay consistent with the source’s categories, it has been included as income. New Hampshire’s removal of interest and dividends tax is also counted as eliminating income taxes.
If not considering Washington, then New Jersey has seen the highest top rate increase (+4.38pp).
Finally, Massachusetts is the only state that switched from flat to marginal rates: putting in a 9% bracket for income above $1.8 million in a year.
Taxes play a huge role in how each state earns revenue. Check out: Every State’s Biggest Source of Tax Revenue for a quick overview.
Tyler Durden Tue, 03/25/2025 - 22:10

