
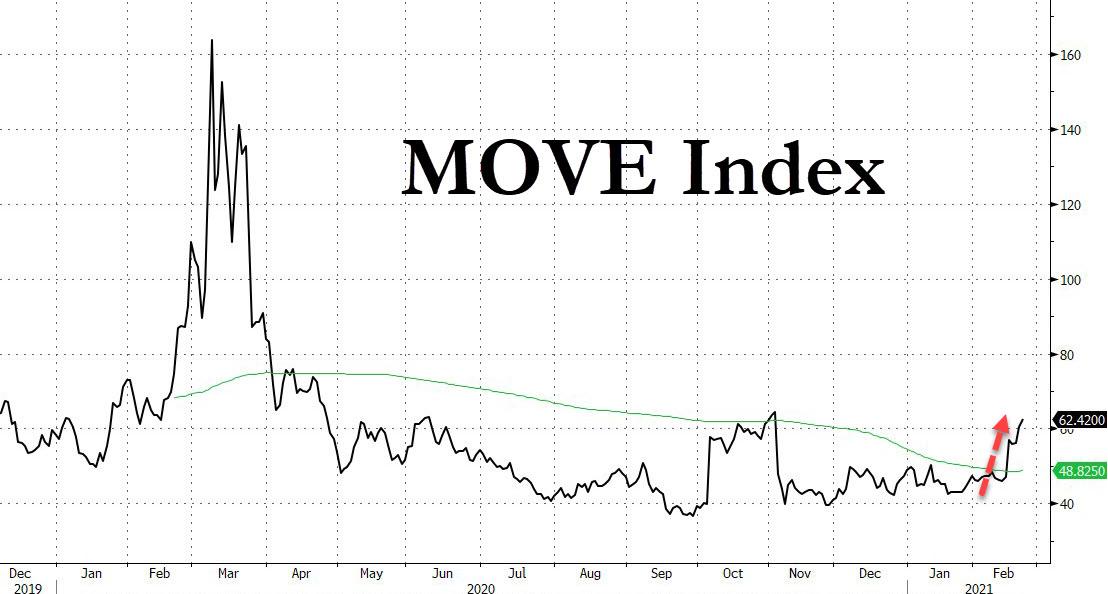
Over the weekend, we listed three indicators to follow in order to determine if yields are about to break out even higher from their current precarious level, including i) watching the the inflation curve, ii) investor fund flows and iii) rate volatility. Of the three, we said that the first two are slow-moving indicators, leaving the aptly named MOVE index as the best real-time measure of potential runaway yields.
Picking up on theme, Bear Traps Report author Larry McDonald notes in his latest publication that the Treasury volatility index (MOVE) broke out to the upside this week and is the highest above its 200 day moving average since March. He notes that "the breakout is confirming the longer term bear market in Treasuries", and cautions that "despite many pointing to the spike in Treasury vol this week, when looking at a 5 year history, there is still significant room to the upside."
As McDonald writes further, the last time Treasury volatility was this high (62) was election day in the U.S. when VIX was trading at 35 (now VIX is 22). And as we first pointed out two weeks ago, Nomura quant Masanari Takada calculated that if the selloff accelerates from here and CTAs move to the short side in UST futures, the move would be become "essentially unstoppable, pushing the 10 year yield to above 1.5% and forcing U.S. equities (the S&P 500) to adjust downward by 8% or more (following the calls from MS and C strategists last couple weeks)."
Should that happen, look for the MOVE to quickly spike, perhaps rising into the triple digits. But what would such a move do to the VIX (and by extension, risk assets)?
The answer comes from the latest strategist to opine on the role and implications of the MOVE Index, Stuart Kaiser, head of equity derivatives research at UBS Securities, who writes that "today anxiety is creeping up in every corner of the market, but it’s rising faster in safe havens than stocks. If the current pace of gains in rates volatility continues, the S&P 500’s “fear gauge” will have to catch up."
According to Keiser, while the level of the VIX Index depends on a strip of S&P 500 options and not directly on yields, a conceptual link between volatility in stocks and rates exists as rising anxiety in one corner of the market could eventually set the stage for a similar advance in the other.
So far, as the chart below shows, the pace of volatility increases hasn’t been equal: rates volatility, which started out from a more subdued level than the VIX, gained a quarter of its value in the five days through Monday, while the “fear gauge” hovered near the lowest point of its range over the past few months. What kept the VIX at bay was the reflation trade, which lifted single- stock dispersion and dampened index volatility, and optimism that inflation isn’t as categorically awful for stocks as it is for the bond market.
“If the level of yields is rising but implied volatility is not, you’re having a controlled move higher that’s not too scary for investors - but that’s not what you’re seeing right now,” Kaiser told Bloomberg, adding that "should we see a repeat of last week - when rates volatility spiked and yields rallied - we’ll be likely seeing a more pronounced reaction in the VIX.”
So how big of a rate move could push the VIX Index out of its recent trading range?
Kaiser said that while it's hard to know apriori, another 25 basis-point move in yields could do it. But before that happens, there’s still some room for rates volatility to advance without a spillover effect on the VIX.
Tyler Durden Tue, 02/23/2021 - 14:50

