The COVID-19 pandemic slowed down the flow of global immigration by 27%.
And, as Visual Capitalist's Richie Lionell details below, alongside it, travel restrictions, job losses, and mounting health concerns meant that many migrant workers couldn’t send money in the form of remittances back to families in their home countries.
This flow of remittances received by countries dropped by 1.5% to $711 billion globally in 2020. But over the next two years, things quickly turned back around.
As visa approvals restarted and international borders opened, so did international migration and global remittance flows.
In 2021, total global remittances were estimated at $781 billion and have further risen to $794 billion in 2022.
In these images, Richie Lionell uses the World Bank’s KNOMAD data to visualize this increasing flow of money across international borders in 176 countries.
Why Do Remittances Matter?Remittances contribute to the economy of nations worldwide, especially low and middle-income countries (LMICs).
They have been shown to help alleviate poverty, improve nutrition, and even increase school enrollment rates in these nations. Research has also found that these inflows of income can help recipient households become resilient, especially in the face of disasters.
At the same time, it’s worth noting that these transfers aren’t a silver bullet for recipient nations. In fact, some research shows that overreliance on remittances can cause a vicious cycle that doesn’t translate to consistent economic growth over time.
Countries Receiving the Highest RemittancesFor the past 15 years, India has consistently topped the chart of the largest remittance beneficiaries.
With an estimated $100 billion in remittances received, India is said to have reached an all-time high in 2022.
This increasing flow of remittances can be partially attributed to migrant Indians switching to high-skilled jobs in high-income countries—including the U.S., the UK, and Singapore—from low-skilled and low-paying jobs in Gulf countries.
Rank Remittance Inflows by Country 2022 (USD) 1 India$100,000M
2 Mexico $60,300M 3 China $51,000M 4 Philippines $38,000M 5 Egypt, Arab Rep. $32,337M 6 Pakistan $29,000M 7 France $28,520M 8 Bangladesh $21,000M 9 Nigeria $20,945M 10 Vietnam $19,000M 11 Ukraine $18,421M 12 Guatemala $18,112M 13 Germany $18,000M 14 Belgium $13,500M 15 Uzbekistan $13,500M 16 Morocco $11,401M 17 Romania $11,064M 18 Dominican Republic $9,920M 19 Indonesia $9,700M 20 Thailand $9,500M 21 Colombia $9,133M 22 Italy $9,000M 23 Nepal $8,500M 24 Spain $8,500M 25 Honduras $8,284M 26 Poland $8,000M 27 Korea, Rep. $7,877M 28 El Salvador $7,620M 29 Lebanon $6,841M 30 Israel $6,143M 31 United States $6,097M 32 Russian Federation $6,000M 33 Serbia $5,400M 34 Brazil $5,045M 35 Japan $5,000M 36 Portugal $4,694M 37 Ghana $4,664M 38 Jordan $4,646M 39 Czech Republic $4,539M 40 Haiti $4,532M 41 Ecuador $4,468M 42 Georgia $4,100M 43 Kenya $4,091M 44 Croatia $3,701M 45 Peru $3,699M 46 Sri Lanka $3,600M 47 West Bank and Gaza $3,495M 48 Jamaica $3,419M 49 Armenia $3,350M 50 Tajikistan $3,200M 51 Nicaragua $3,126M 52 Kyrgyz Republic $3,050M 53 Senegal $2,711M 54 Austria $2,700M 55 Switzerland $2,631M 56 Sweden $2,565M 57 United Kingdom $2,501M 58 Hungary $2,404M 59 Bosnia and Herzegovina $2,400M 60 Slovak Republic $2,300M 61 Moldova $2,170M 62 Azerbaijan $2,150M 63 Tunisia $2,085M 64 Zimbabwe $2,047M 65 Luxembourg $2,000M 66 Netherlands $2,000M 67 Myanmar $1,900M 68 Algeria $1,829M 69 Albania $1,800M 70 Somalia $1735M 71 Congo, Dem. Rep. $1,664M 72 Malaysia $1,620M 73 Kosovo $1,600M 74 Denmark $1,517M 75 Latvia $1,500M 76 Bolivia $1,403M 77 Belarus $1,350M 78 Cambodia $1,250M 79 Bermuda $1,200M 80 South Sudan $1,187M 81 Uganda $1,131M 82 Mali $1,094M 83 South Africa $1,019M 84 Sudan $1,013M 85 Argentina $966M 86 Montenegro $920M 87 Finland $880M 88 Bulgaria $850M 89 Slovenia $800M 90 Australia $737M 91 Madagascar $718M 92 Turkey $710M 93 Canada $700M 94 Lithuania $700M 95 Togo $668M 96 Greece $665M 97 Costa Rica $654M 98 Estonia $626M 99 Qatar $624M 100 Iraq $624M 101 Gambia, The $615M 102 Tanzania $609M 103 Norway $600M 104 Panama $596M 105 Burkina Faso $589M 106 Hong Kong SAR, China $571M 107 Paraguay $554M 108 Mozambique $545M 109 Niger $534M 110 Cyprus $527M 111 Lesotho $527M 112 Mongolia $500M 113 Rwanda $469M 114 Fiji $450M 115 North Macedonia $450M 116 Guyana $400M 117 Cabo Verde $375M 118 Kazakhstan $370M 119 Cameroon $365M 120 Cote d'Ivoire $360M 121 Liberia $351M 122 Afghanistan $350M 123 Ethiopia $327M 124 Samoa $280M 125 Mauritius $279M 126 Saudi Arabia $273M 127 Malta $271M 128 Malawi $267M 129 Zambia $260M 130 Tonga $250M 131 Comoros $250M 132 Ireland $249M 133 Suriname $221M 134 Benin $209M 135 Lao PDR $200M 136 Timor-Leste $185M 137 Sierra Leone $179M 138 Guinea-Bissau $178M 139 Trinidad and Tobago $172M 140 Mauritania $168M 141 Iceland $164M 142 Eswatini $148M 143 Belize $142M 144 Curacao $131M 145 Uruguay $127M 146 Chile $78M 147 Vanuatu $75M 148 St. Vincent and the Grenadines $70M 149 Grenada $69M 150 Botswana $56M 151 St. Lucia $55M 152 Bhutan $55M 153 Djibouti $55M 154 Dominica $52M 155 Burundi $50M 156 Aruba $44M 157 Namibia $44M 158 Guinea $41M 159 Solomon Islands $40M 160 Oman $39M 161 Antigua and Barbuda $35M 162 St. Kitts and Nevis $33M 163 Marshall Islands $30M 164 Kuwait $27M 165 New Zealand $25M 166 Macao SAR, China $17M 167 Angola $16M 168 Kiribati $15M 169 Cayman Islands $14M 170 Sao Tome and Principe $10M 171 Seychelles $9M 172 Maldives $5M 173 Gabon $4M 174 Palau $2M 175 Papua New Guinea $2M 176 Turkmenistan $1M Total World $794,059MMexico and China round out the top three remittance-receiving nations, with estimated inbound transfers of $60 billion and $51 billion respectively in 2022.
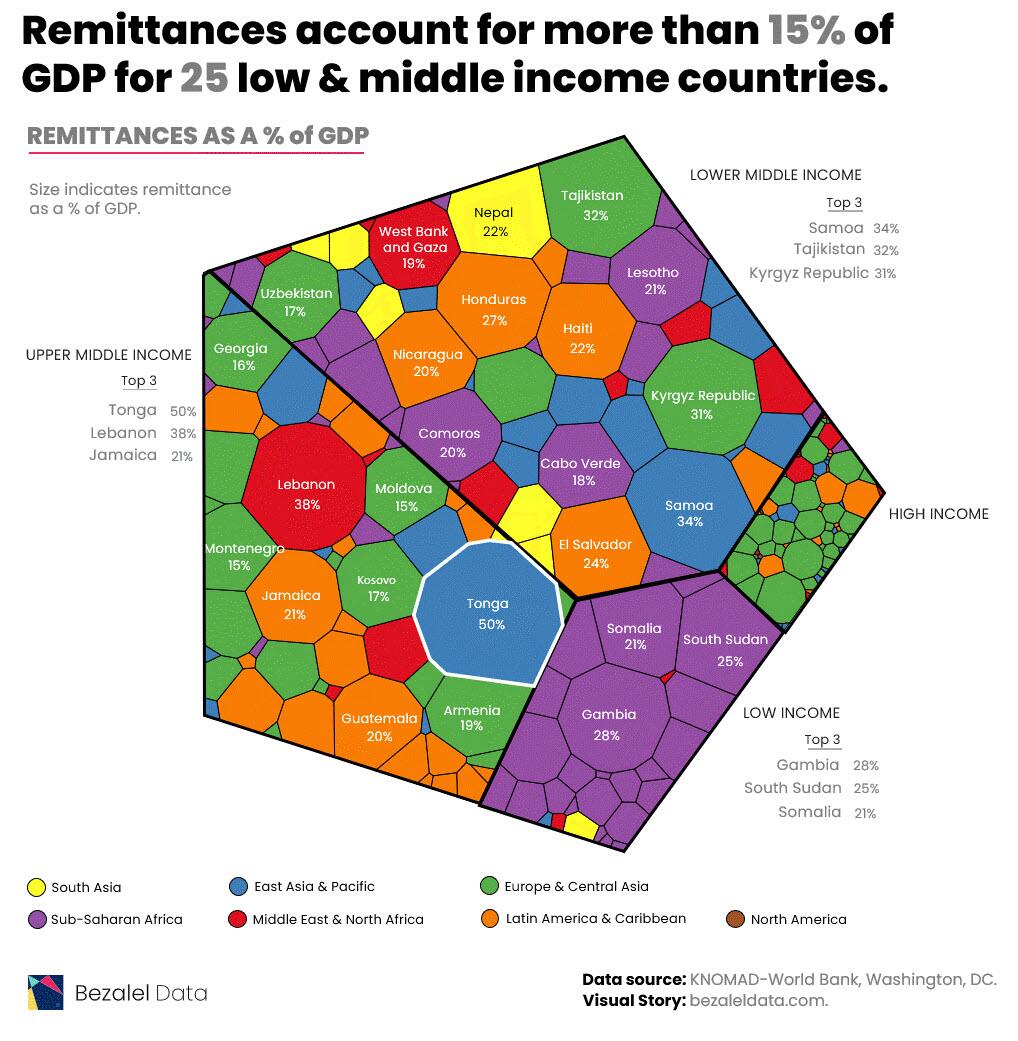
Impact on National GDPWhile India tops the list of countries benefitting from remittances, its $100 billion received amounts to only 2.9% of its 2022 GDP.
Meanwhile, low and middle-income countries around the world heavily rely on this source of income to boost their economies in a more substantive way. In 2022, for example, remittances accounted for over 15% of the GDP of 25 countries.
Rank Remittance Inflows by Country % of GDP (2022) 1 Tonga 49.9% 2 Lebanon 37.8% 3 Samoa 33.7% 4 Tajikistan 32.0% 5 Kyrgyz Republic 31.2% 6 Gambia, The 28.3% 7 Honduras 27.1% 8 South Sudan 24.8% 9 El Salvador 23.8% 10 Haiti 22.4% 11 Nepal 21.7% 12 Jamaica 21.2% 13 Lesotho 21.0% 14 Somalia 20.6% 15 Comoros 20.1% 16 Nicaragua 19.9% 17 Guatemala 19.8% 18 Armenia 18.9% 19 West Bank and Gaza 18.5% 20 Cabo Verde 18.2% 21 Kosovo 17.3% 22 Uzbekistan 17.0% 23 Georgia 16.2% 24 Moldova 15.4% 25 Montenegro 15.0% 26 Ukraine 13.8% 27 Marshall Islands 11.0% 28 Guinea-Bissau 10.9% 29 Bosnia and Herzegovina 10.1% 30 Albania 9.8% 31 Senegal 9.8% 32 Jordan 9.6% 33 Philippines 9.4% 34 Fiji 9.2% 35 Liberia 9.0% 36 Dominican Republic 8.8% 37 Dominica 8.6% 38 Serbia 8.6% 39 Togo 7.9% 40 Morocco 7.9% 41 Pakistan 7.7% 42 Vanuatu 7.6% 43 Timor-Leste 7.5% 44 Suriname 7.3% 45 St. Vincent and the Grenadines 7.3% 46 Kiribati 7.2% 47 Egypt, Arab Rep. 6.8% 48 Ghana 6.1% 49 Mali 5.9% 50 Grenada 5.8% 51 Zimbabwe 5.3% 52 Croatia 5.3% 53 Belize 5.3% 54 Sri Lanka 4.8% 55 Madagascar 4.7% 56 Vietnam 4.5% 57 Bangladesh 4.5% 58 Tunisia 4.5% 59 Cambodia 4.4% 60 Sierra Leone 4.3% 61 Mexico 4.2% 62 Nigeria 4.1% 63 Rwanda 3.8% 64 Ecuador 3.8% 65 Latvia 3.6% 66 Romania 3.6% 67 Niger 3.6% 68 Kenya 3.5% 69 Bolivia 3.2% 70 Burkina Faso 3.2% 71 Myanmar 3.1% 72 North Macedonia 3.1% 73 Mongolia 3.1% 74 Eswatini 3.1% 75 Azerbaijan 3.0% 76 Mozambique 3.0% 77 St. Kitts and Nevis 2.9% 78 India 2.8% 79 St. Lucia 2.7% 80 Guyana 2.6% 81 Colombia 2.6% 82 Congo, Dem. Rep. 2.6% 83 Solomon Islands 2.4% 84 Luxembourg 2.4% 85 Mauritius 2.4% 86 Sudan 2.3% 87 Uganda 2.3% 88 Malawi 2.3% 89 Belgium 2.2% 90 Sao Tome and Principe 2.0% 91 Afghanistan 2.0% 92 Slovak Republic 2.0% 93 Antigua and Barbuda 2.0% 94 Bhutan 2.0% 95 Cyprus 1.9% 96 Portugal 1.8% 97 Thailand 1.7% 98 Belarus 1.6% 99 Mauritania 1.6% 100 Estonia 1.6% 101 Malta 1.5% 102 Peru 1.5% 103 Czech Republic 1.5% 104 Djibouti 1.4% 105 Burundi 1.3% 106 Paraguay 1.3% 107 Hungary 1.3% 108 Slovenia 1.2% 109 Aruba 1.2% 110 Lao PDR 1.2% 111 Benin 1.1% 112 Israel 1.1% 113 Poland 1.1% 114 Lithuania 1.0% 115 France 1.0% 116 Bulgaria 0.9% 117 Algeria 0.9% 118 Zambia 0.9% 119 Costa Rica 0.9% 120 Palau 0.8% 121 Panama 0.8% 122 Cameroon 0.8% 123 Tanzania 0.7% 124 Indonesia 0.7% 125 Spain 0.6% 126 Iceland 0.5% 127 Trinidad and Tobago 0.5% 128 Austria 0.5% 129 Cote d'Ivoire 0.5% 130 Seychelles 0.4% 131 Korea, Rep. 0.4% 132 Italy 0.4% 133 Germany 0.4% 134 Sweden 0.4% 135 Denmark 0.3% 136 Malaysia 0.3% 137 Namibia 0.3% 138 Switzerland 0.3% 139 Finland 0.3% 140 Botswana 0.3% 141 Greece 0.2% 142 Ethiopia 0.2% 143 Qatar 0.2% 144 Russian Federation 0.2% 145 Brazil 0.2% 146 China 0.2% 147 South Africa 0.2% 148 Iraq 0.2% 149 Guinea 0.2% 150 Netherlands 0.2% 151 Uruguay 0.1% 152 Kazakhstan 0.1% 153 Hong Kong SAR, China 0.1% 154 Argentina 0.1% 155 Norway 0.1% 156 Japan 0.1% 157 Maldives 0.08% 158 Turkey 0.08% 159 United Kingdom 0.07% 160 Macao SAR, China 0.07% 161 Ireland 0.05% 162 Australia 0.04% 163 Oman 0.04% 164 Saudi Arabia 0.03% 165 Chile 0.02% 166 United States 0.02% 167 Gabon 0.02% 168 Kuwait 0.01% 169 Angola 0.01% 170 New Zealand 0.01% 171 Papua New Guinea 0.01% 172 Turkmenistan 0.001%Known primarily as a tourist destination, the Polynesian country of Tonga banks on remittance inflows to support its economy. In 2022, the country’s incoming remittance flows were equal to almost 50% of its GDP.
Next on this list is Lebanon. The country received $6.8 billion in remittances in 2022, estimated to equal almost 38% of its GDP and making it a key support to the nation’s shrinking economy.
Tyler Durden Fri, 01/27/2023 - 23:25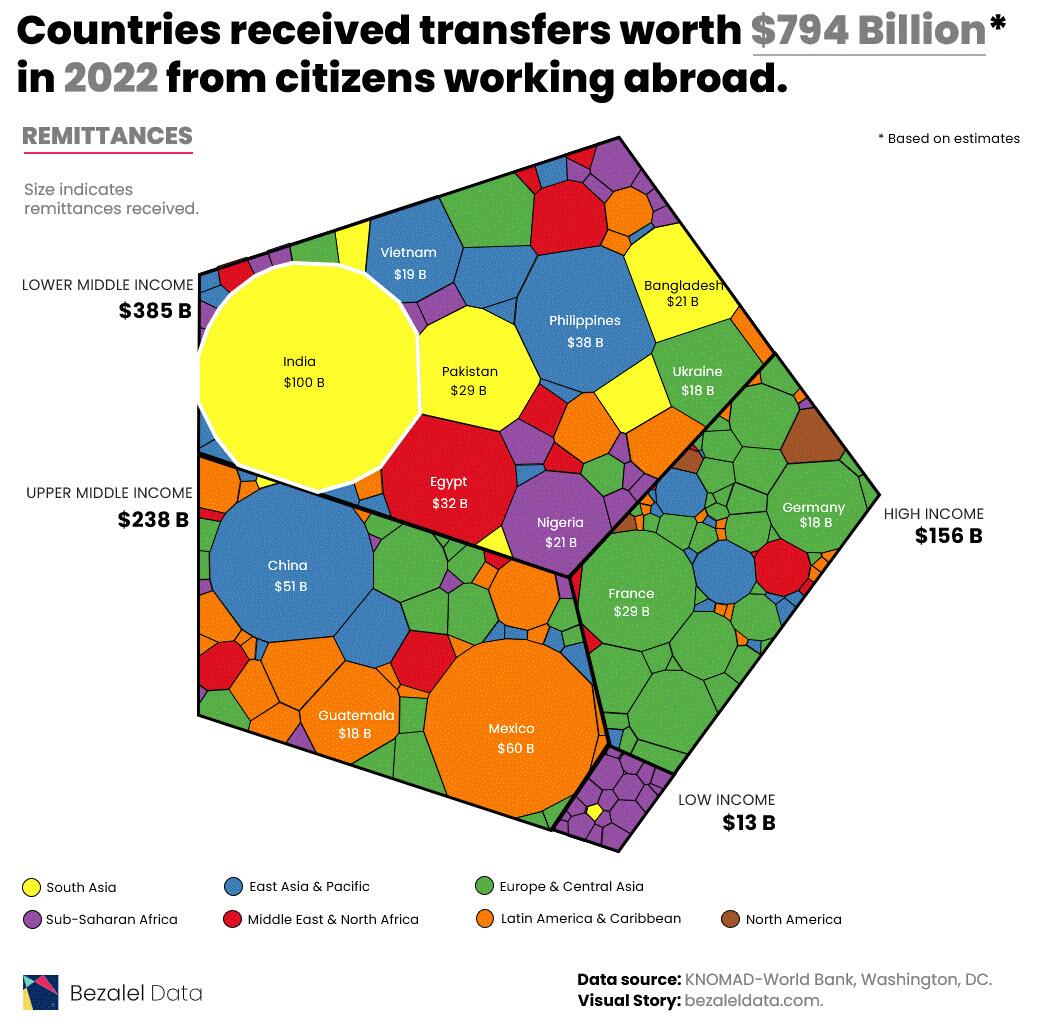